")
")
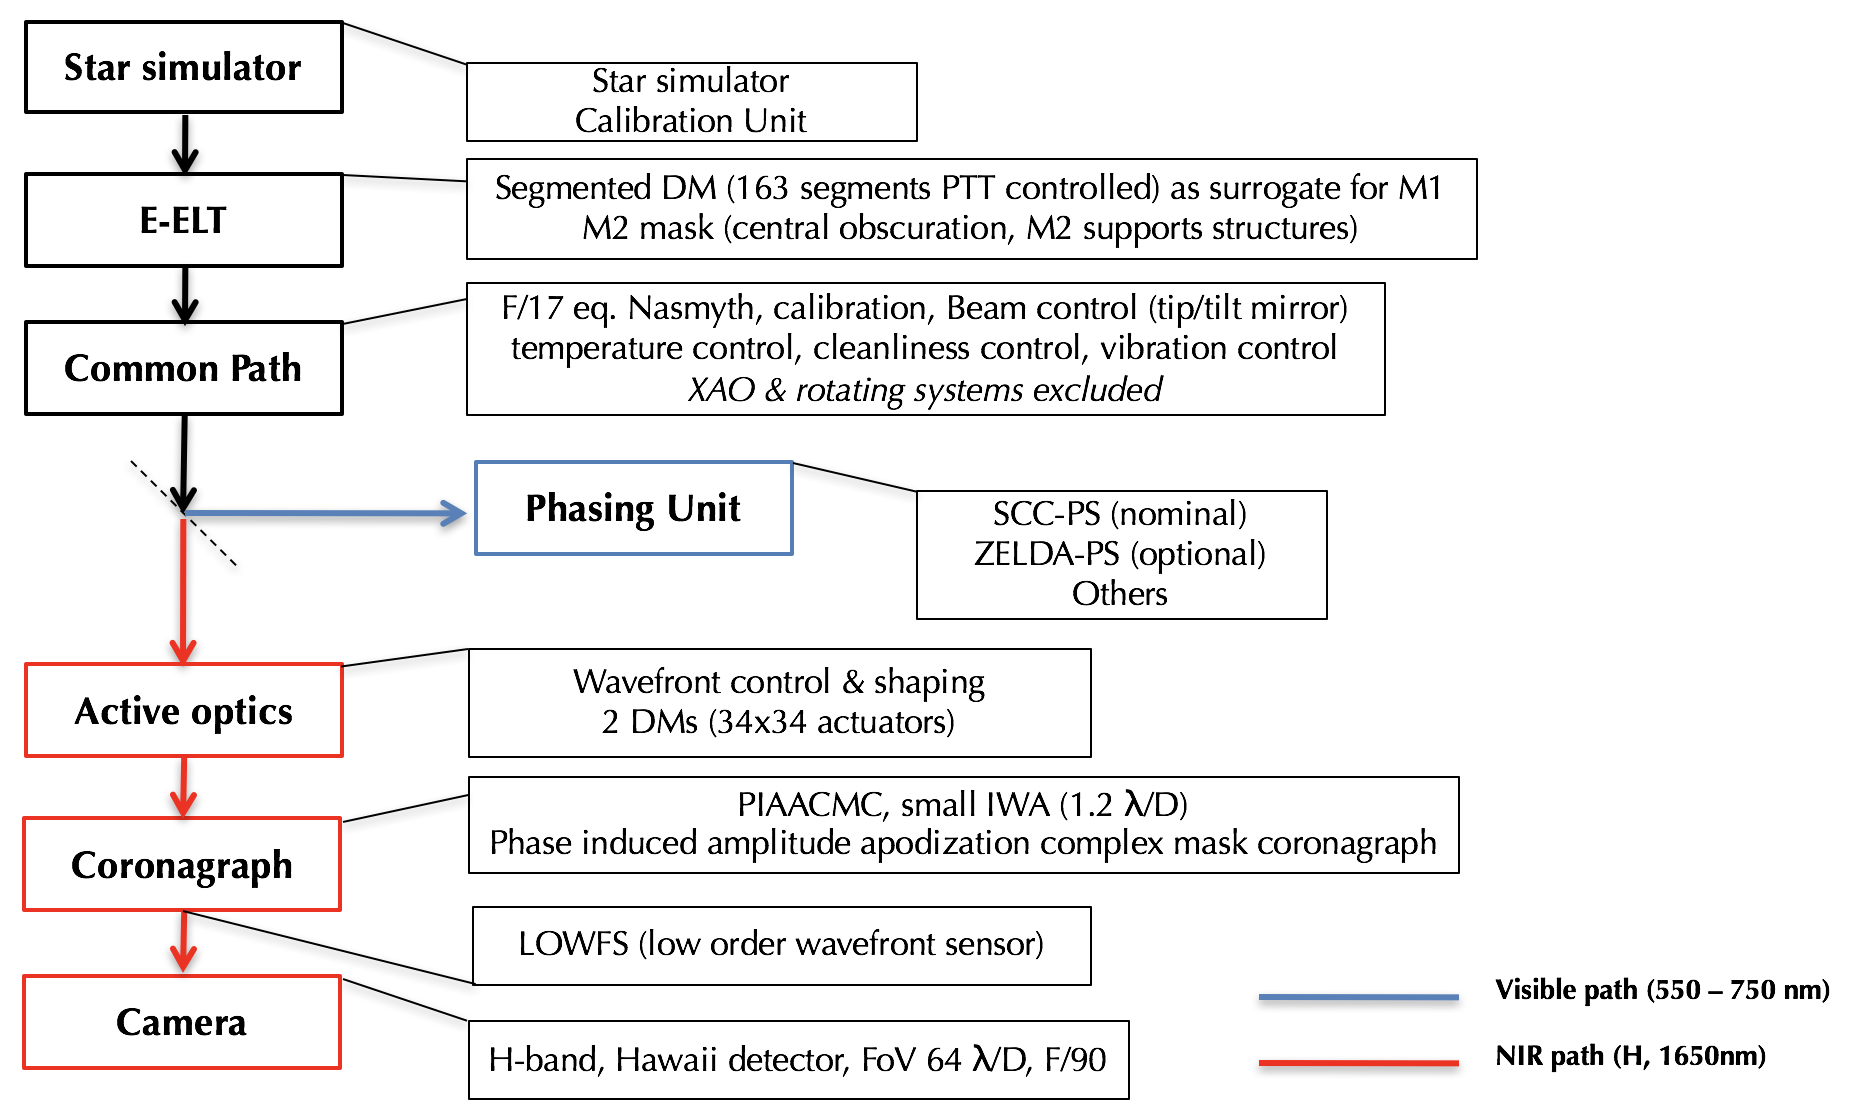
Figure 1 - Architectural principle of the SPEED bench.
The architectural principle of the SPEED bench (Fig. 1) is presented in the above diagram. The field of view of interest is restricted to 8 λ/D in radius given the aimed objective of high contrast at small angular separations. The bench is therefore composed of a visible cophasing optical path (in blue) and a near-infrared path (in red) dedicated to high contrast.
The common path is in orange colour in the 3D CAO view of the bench presented above (Fig. 2). The visible path dedicated to the optical cophasing corresponds to the blue lines and the near-infrared path, dedicated to high-contrast imaging, corresponds to the red lines.
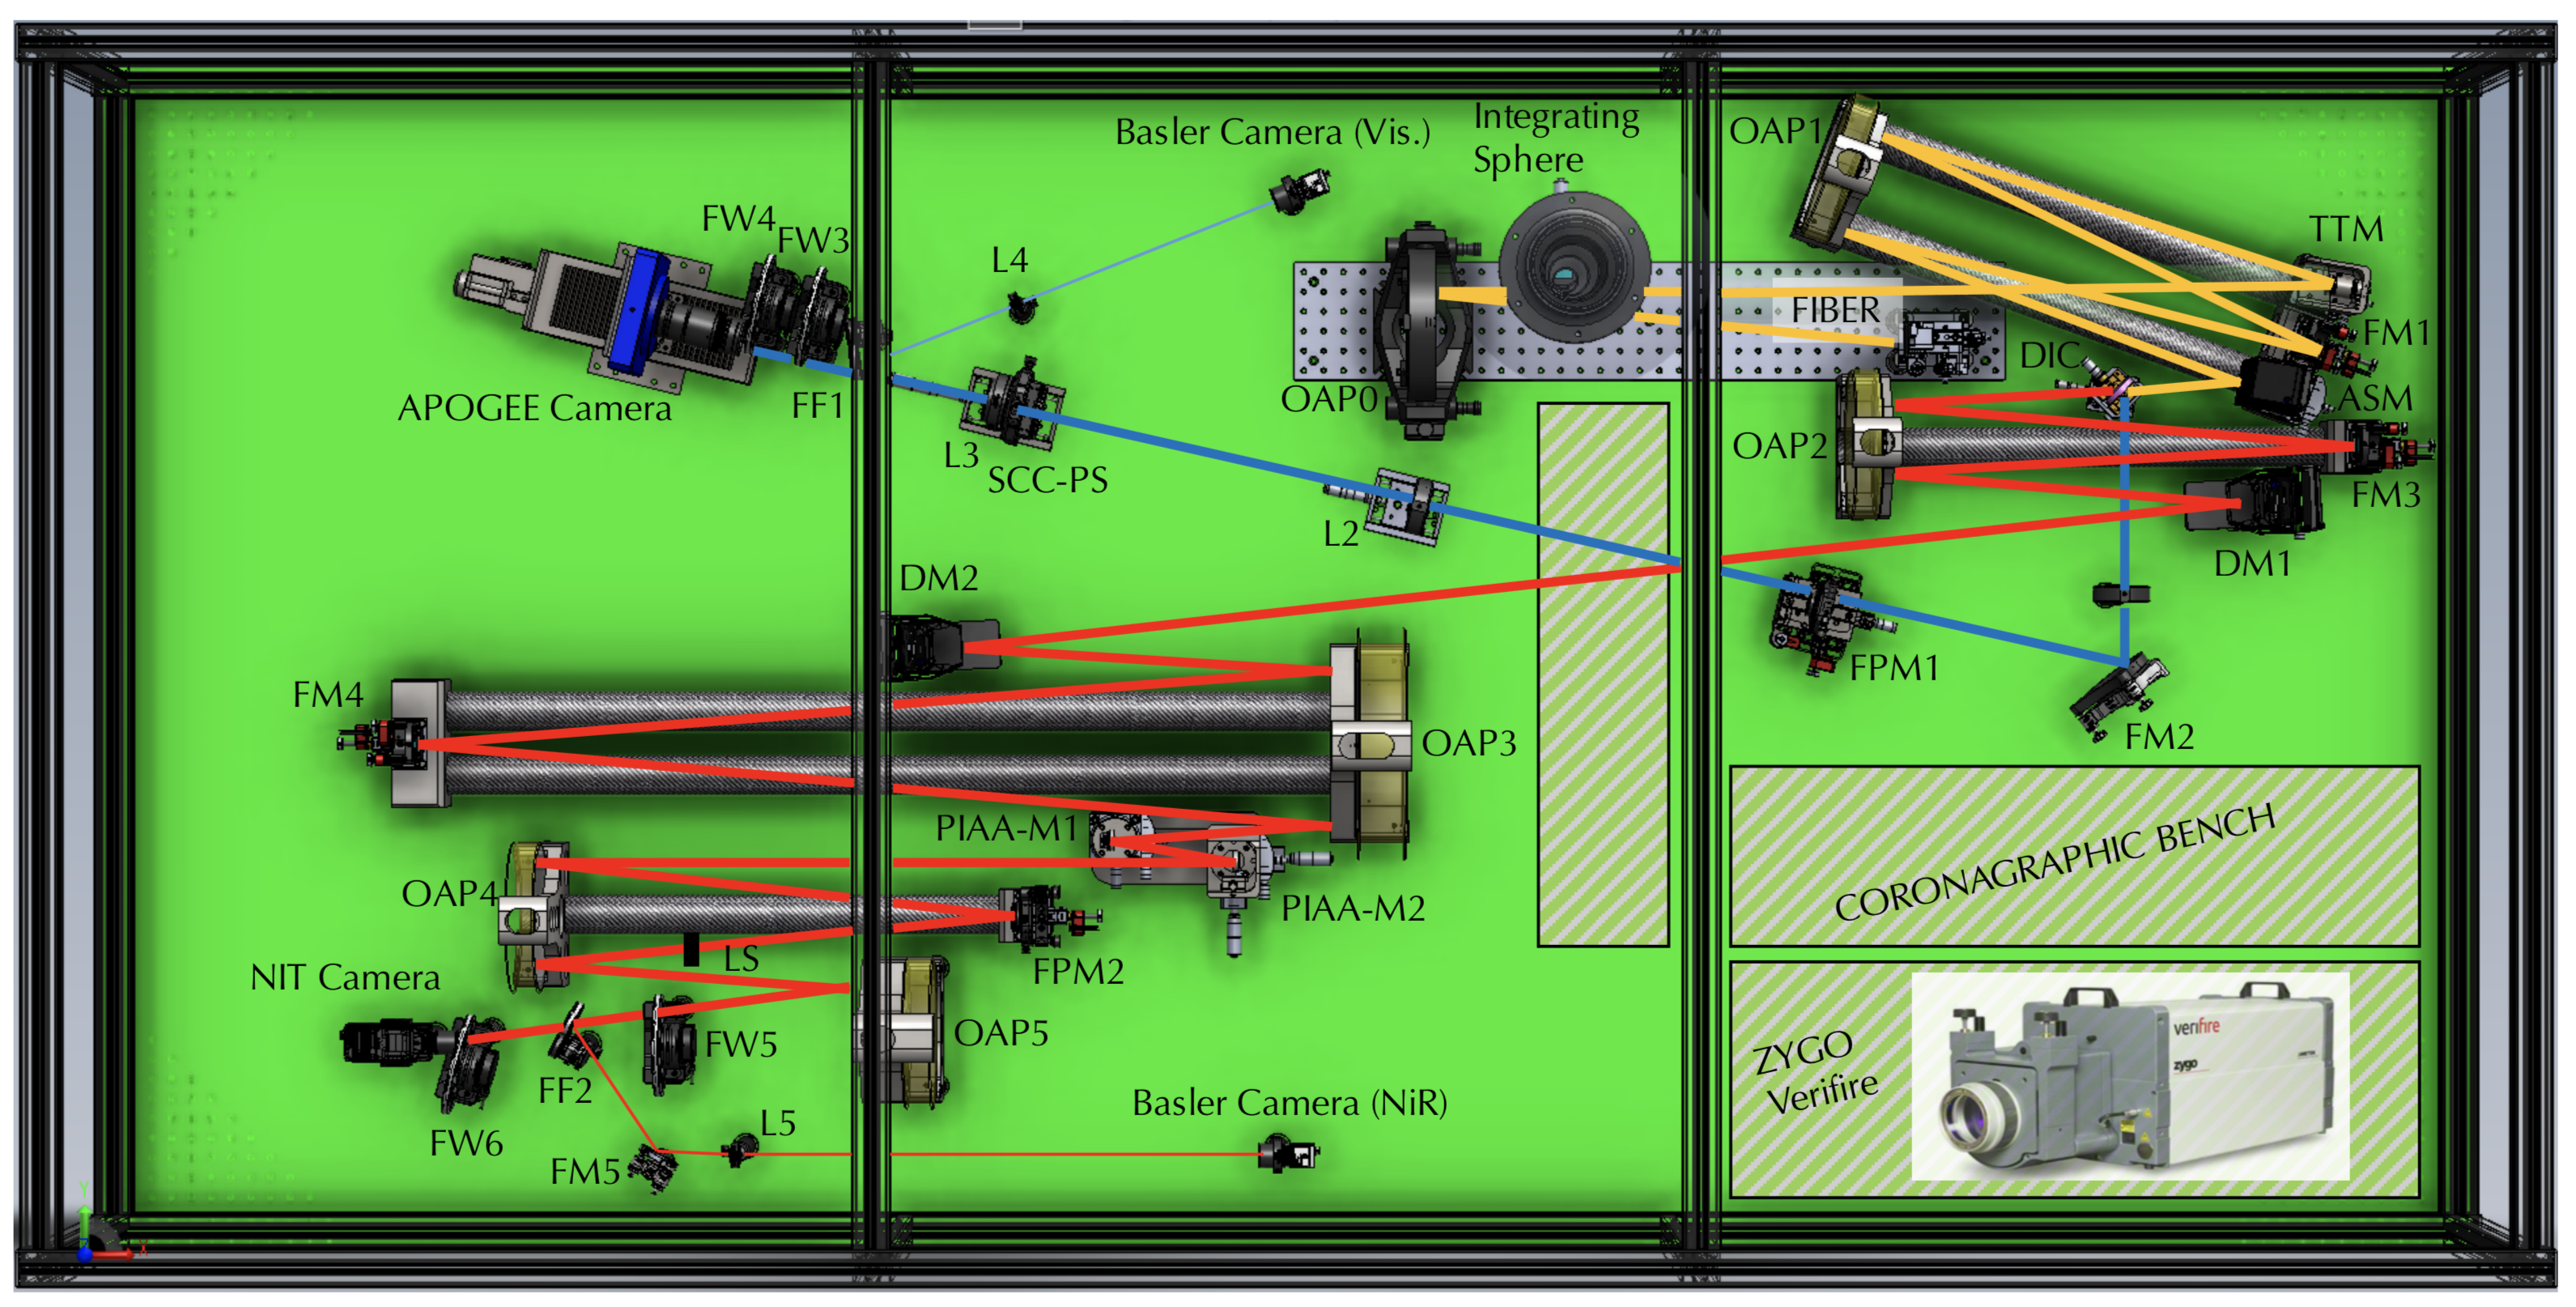
Figure 2 - 3D CAO view of the SPEED bench.
The Speed bench is installed in a clean-room environment (ISO7 classroom, Fig. 3) at the Lagrange Laboratory, FIZEAU building on the Valrose campus in the city centre of Nice.
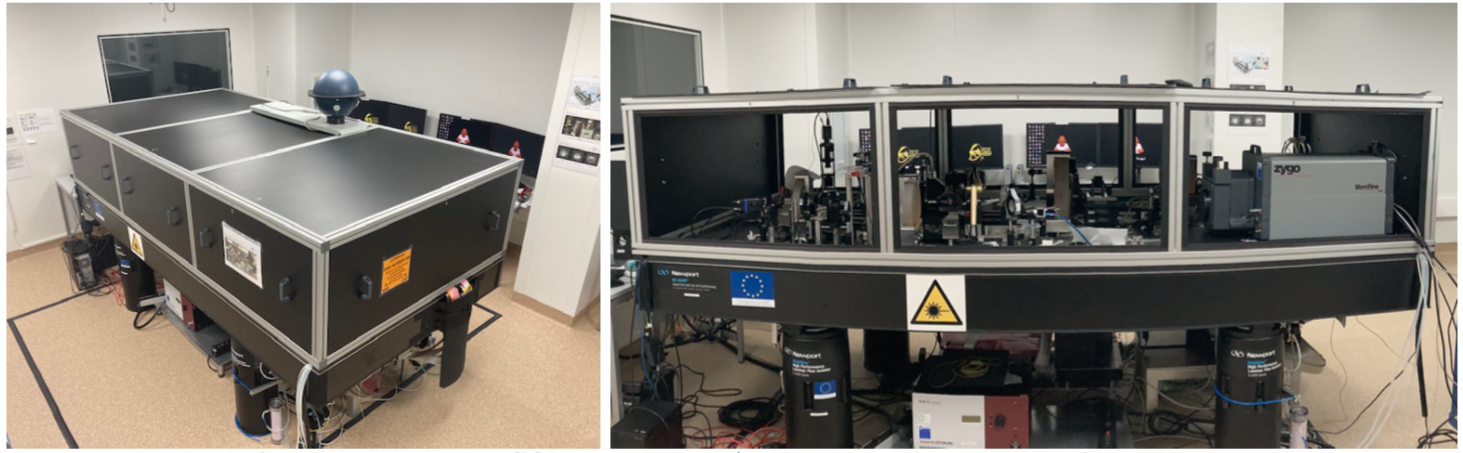
Figure 3 - Pictures of the SPEED bench, ISO7 classroom.
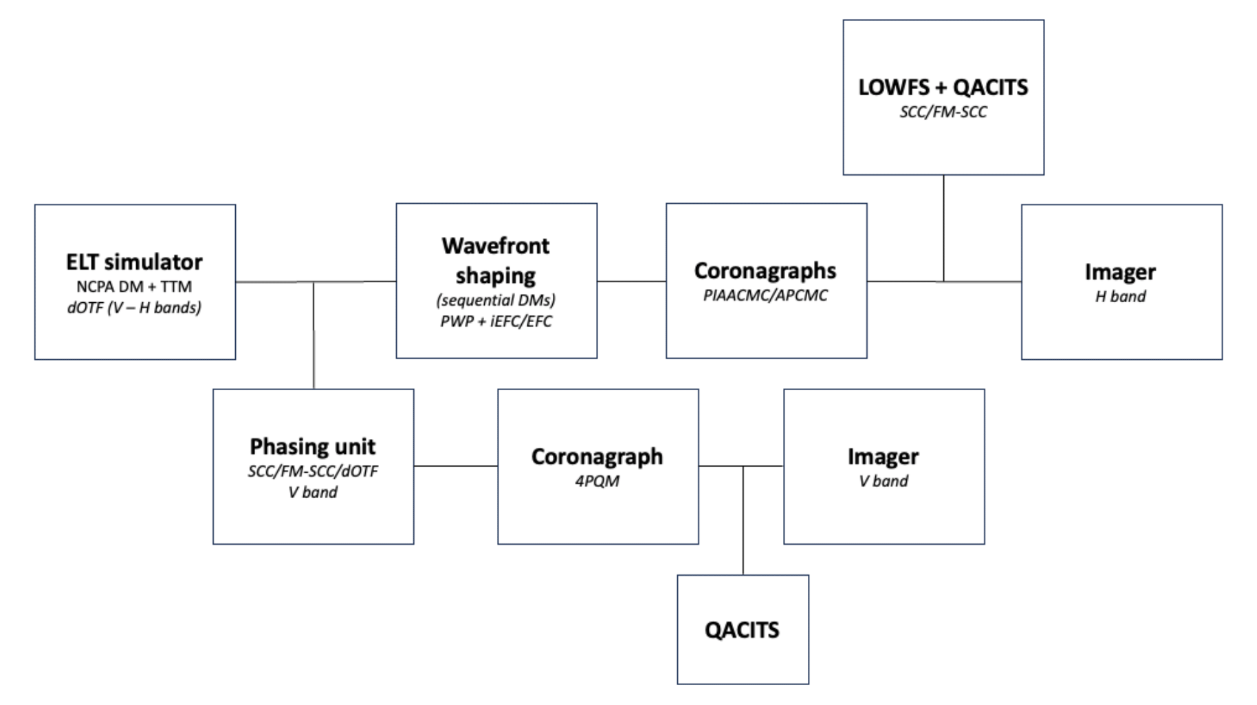
Figure 4 - Concept diagram of the SPEED FPWFS.
Concept diagram of the SPEED test bed showing the main building blocks and highlighting the focal plane wavefront sensors available (Fig. 4) and involved in the calibration and observing modes.
Figure 4 presents a concept diagram of the SPEED test bed presenting the main building blocks, highlighting the FPWFS present in the bench for flattening and shaping the wavefront. SPEED offers the SCC in both optical (cophasing) and NIR infrared arms for complex field estimation for shaping the wavefront, with FM-SCC extension in both arms. The dOTF is also used in both optical paths for NCPA estimation and correction using the ASM. The PWP is being implemented in the NIR path and coupled to EFC, while iEFC is available for generating a dark hole in the science image. In addition to these wavefront sensors, a QACITS sensor is available. QACITS (Quadrant Analysis of Coronagraphic Images for Tip-tilt Sensing) is a tip-tilt sensing technique based on the analysis of the flux asymmetry of the coronagraphic image (FQPM, PIAACMC/APCMC) that appears when the star image is not perfectly centred on the coronagraphic focal plane mask.
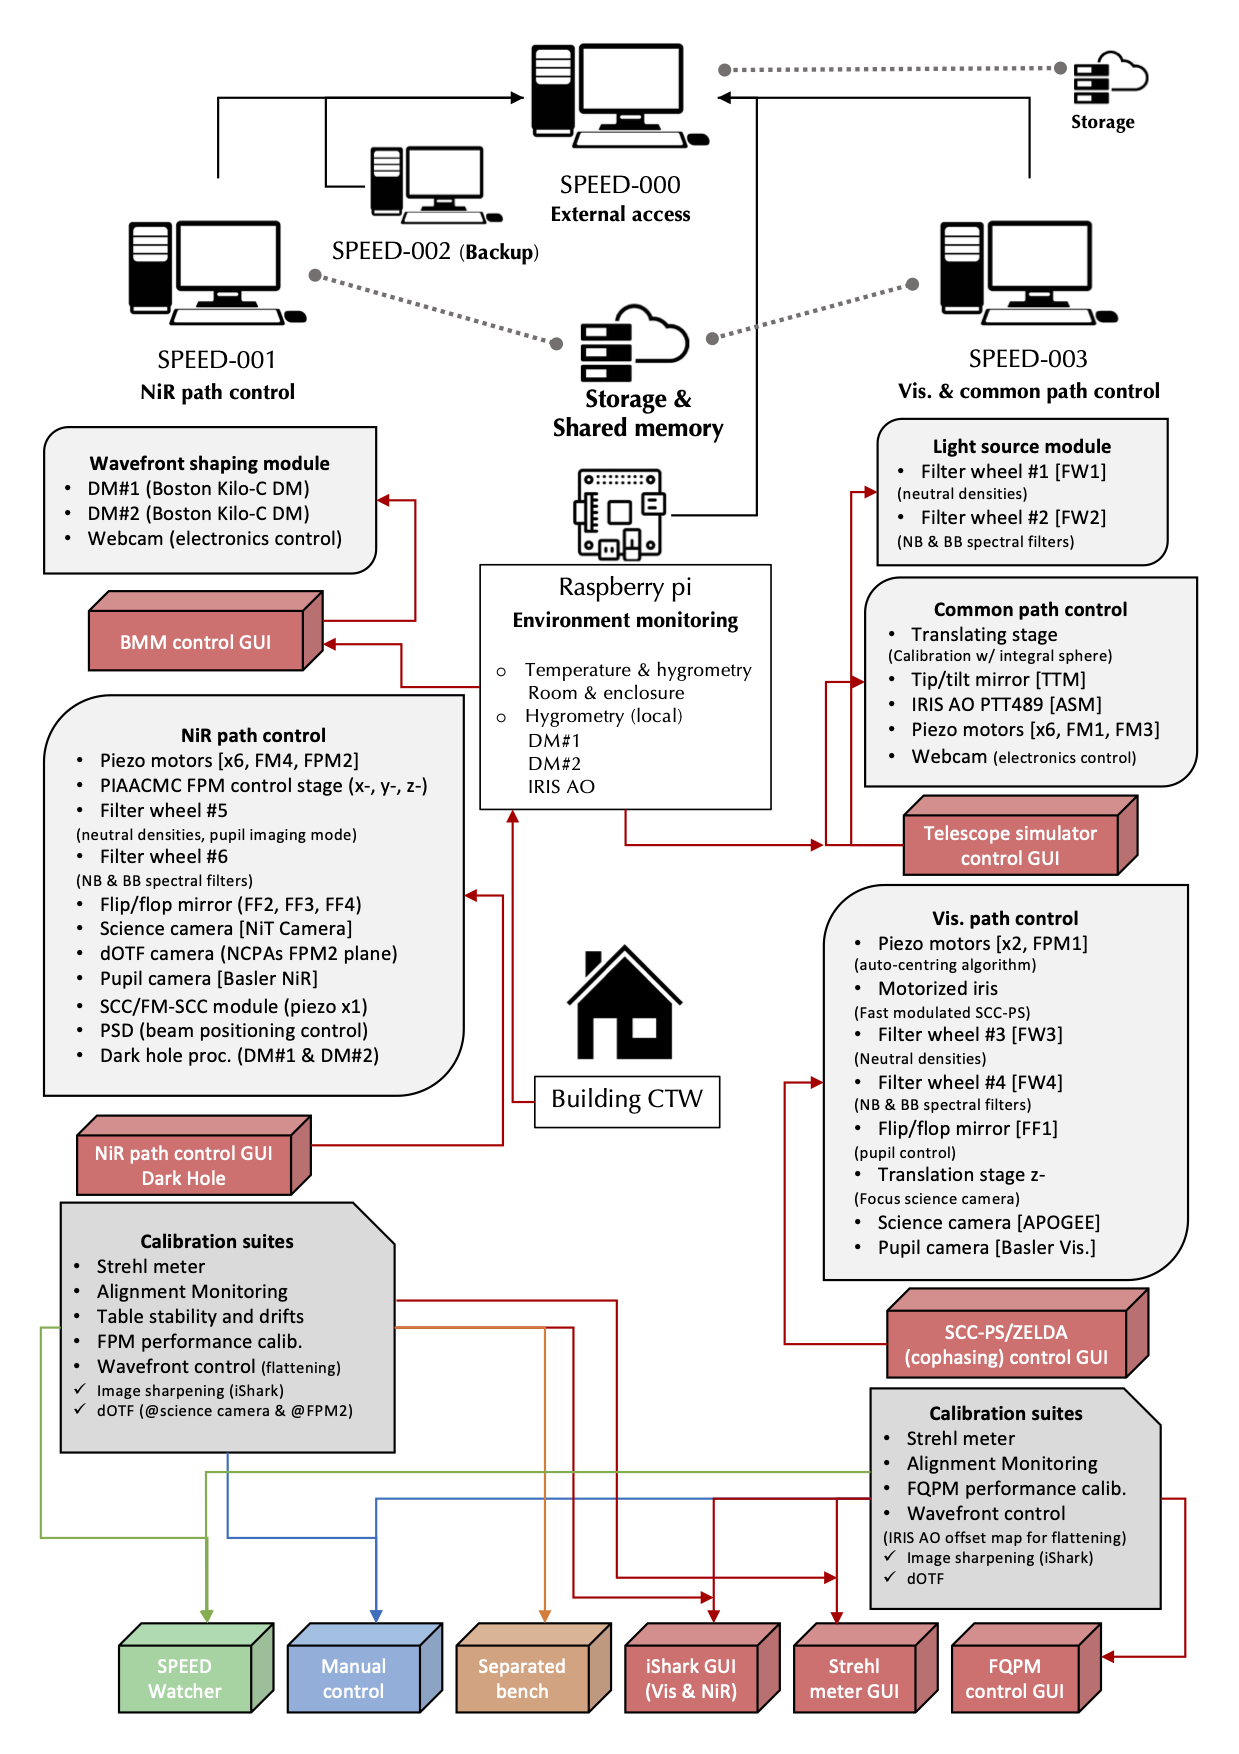
Figure 5 - Schematic representation of the SPEED control software architecture
Figure 5 describes workstations distribution, GUIs(in red), controllable devices (green areas) and devices dispatch, as well as sub-GUIs or actions: in red (using dedicatedGUIs), in blue for manual operation, in brown using a separated bench, and in green for monitoring.
The SPEED test-bed being more complex than a simple laboratory test bench but less demanding than an on-sky instrument at a telescope, imposes a specific and adapted system and software control development. For more details, clic here, where we report on the design of the SPEED system control hardware and software infrastructure that enables the bench to operate efficiently andsafely.